
The catch: there is no single price. Your bill depends on billing model, tier, region, redundancy, capacity, transactions, performance, and data protection. Quotas add a second layer of confusion, because a ceiling is not a charge.
This guide covers the pricing models, quota limits, cost components, and a budgeting method. All rates are US list prices in USD for East US 2, LRS, checked 2026-11-18. Confirm them against Microsoft's pricing page before you commit.
Key Takeaways
- No universal per-GB price exists; rates vary by model, region, and redundancy.
- Provisioned v2 bills capacity, IOPS, and throughput separately.
- Pay-as-you-go adds transaction, metadata, and retrieval charges.
- A quota or share maximum is a ceiling, not a bill.
- Pick the tier by workload fit, not the lowest GiB rate.
How Much Does Azure Files Cost? (Pricing Overview)
Azure Files has no fixed price. Every number below applies to one region (East US 2), one redundancy option (LRS), and one date. Verify against Microsoft's Azure Files pricing page and the Azure Pricing Calculator before budgeting.
Three mistakes show up repeatedly:
- Budgeting capacity only, and skipping transactions, snapshots, backup, redundancy, data transfer, or sync
- Buying Premium or provisioned performance for a peak without checking real utilization
- Treating a maximum share size as the amount billed
Azure Files Pricing Models
Four models are currently relevant:
| Model | Bills for | Protocols / redundancy |
|---|---|---|
| Provisioned v2 SSD | Provisioned GiB, IOPS, MiB/s | SMB or NFS; LRS/ZRS |
| Provisioned v2 HDD | Same three meters | SMB; LRS/ZRS/GRS/GZRS |
| Provisioned v1 SSD (Premium) | Provisioned capacity, with performance tied to it | SMB or NFS; LRS/ZRS |
| Pay-as-you-go HDD (Standard) | Used capacity, transactions, snapshots | SMB; LRS/ZRS/GRS/GZRS |
Pay-as-you-go (Standard HDD)
You pay for data actually stored, plus operations. Rates for East US 2:
| Meter | Transaction-optimized | Hot | Cool |
|---|---|---|---|
| Used GiB/month | $0.0600 | $0.0255 | $0.0150 |
| Metadata GiB/month | Included | $0.0263 | $0.0263 |
| Write ops per 10,000 | $0.015 | $0.065 | $0.13 |
| Read ops per 10,000 | $0.0015 | $0.0052 | $0.013 |
| Retrieval per GiB | N/A | N/A | $0.01 |
Cool looks cheapest per GiB, but it has the highest write cost and adds retrieval charges. This model suits general-purpose shares with modest, predictable activity. No minimum retention period for hot or cool is listed on Microsoft's pricing page; confirm current rules if retention matters for your workload.
Premium SSD (provisioned v1)
Provisioned v1 SSD costs $0.16 per provisioned GiB/month, and performance scales with the capacity you buy. Snapshots run $0.136 per GiB. Optional paid bursting costs $0.50 per million transactions plus $0.01 per GiB transferred.
The extra cost is justified for latency-sensitive, IOPS-heavy, or metadata-intensive workloads. You may end up buying capacity just to get performance.
Provisioned v2
Provisioned v2 is generally available across public Azure and US Government regions, though media and redundancy options vary by region. It bills three independent meters:
| Meter | v2 SSD | v2 HDD |
|---|---|---|
| Provisioned GiB/month | $0.1001 | $0.0073 |
| IOPS/month | $0.0271 (first 3,000 included) | $0.0402 |
| MiB/s per month | $0.0395 (first 100 included) | $0.0599 |

The included allowances apply to SSD only. Separate meters make budgets predictable, but you pay for every unit you provision whether you use it or not. Reductions are blocked until 24 hours after your last increase.
What the Quoted Price Includes and Excludes
Here is one sample: a v2 HDD share, East US 2, LRS, with 10 TiB (10,240 GiB) provisioned, 2,000 IOPS, and 200 MiB/s.
| Line item | Calculation | Monthly cost |
|---|---|---|
| Capacity | 10,240 × $0.0073 | $74.75 |
| IOPS | 2,000 × $0.0402 | $80.40 |
| Throughput | 200 × $0.0599 | $11.98 |
| Transactions | No separate charge in v2 | $0 |
| Subtotal | $167.13 |
This is an illustration, not a quote. Snapshots only bill once they overflow unused provisioned capacity. Backup, redundancy upgrades, networking, and sync are added on top. Note that the IOPS line outweighs capacity here, which a per-GB figure would hide.

Key Factors That Affect Azure Files Pricing and Quotas
Cost and scale depend on technical, operational, and business choices. Verify every limit and price against Microsoft documentation, since both change.
Tier, Protocol, Redundancy, and Billing Model
- SMB works across all models; NFS 4.1 is available only on SSD (v1 and v2). A share cannot support both protocols.
- HDD suits general-purpose shares and archives. SSD suits lift-and-shift applications, VDI, and latency-sensitive work.
- LRS is cheapest. ZRS adds zone resilience. GRS and GZRS add a secondary region, available on HDD models but not SSD.
- On GRS pay-as-you-go, geo-replication transfer costs $0.02 per GiB. GRS v2 HDD in East US 2 runs $0.0161 per GiB-month.
Quotas and Service Limits to Verify
Published maximums for classic shares in storage accounts:
| Limit | v2 SSD | v2 HDD | v1 SSD | Pay-as-you-go |
|---|---|---|---|---|
| Share capacity | 256 TiB | 256 TiB | 100 TiB | 100 TiB |
| Share IOPS | 102,400 | 50,000 | 102,400 | 20,000 |
| Shares per account | 50 | 50 | 1,024 | Unlimited |
| Minimum share size | 32 GiB | 32 GiB | 100 GiB | 0 bytes |
Other limits to check before deployment:
- Maximum file size: 4 TiB
- Snapshots per share: 200
- Open handles: 10,000 on the root directory, 2,000 per file or directory
- Storage accounts per subscription per region: 250 by default, up to 500
- Per-file IOPS: 12,000 on SSD, 1,000 on HDD
Hard service limits differ from configurable allocations. In v2 you set capacity, IOPS, and throughput independently. In v1, capacity determines performance. In pay-as-you-go, a quota caps growth without driving billing.
Account-level limits can also throttle a share that sits within its own allocation. If you approach a ceiling, expect to split the workload across shares or accounts, change tier, or provision more performance.
Performance and Workload Behavior
Metadata operations have their own ceilings: 35,000 IOPS on SSD NFS (or SSD SMB with metadata caching), 12,000 otherwise. Extra data IOPS do not lift them.
Microsoft's VDI illustration assumes about 10 IOPS per user in steady state, roughly 20,000 total, spiking to 75,000 at sign-in. Treat these as scenario assumptions. SMB Multichannel helps multithreaded workloads but only on SSD.

Pay-as-you-go has no burst mechanism, and v2 bursting is best effort, so guaranteed peaks need provisioned performance. Pull current per-share and per-account figures from Microsoft rather than older announcements.
Azure Files Cost Breakdown
Storage Capacity
Pay-as-you-go bills only the data you store. Provisioned models bill allocated capacity even when empty. Growth and free space drive cost under provisioned pricing; quota settings act only as a growth cap on pay-as-you-go.
Transactions
Opening a handle counts as a write, even when you only read. List operations enumerate contents, reads access data, and deletes are free. Small-file, metadata-heavy workloads on pay-as-you-go can cost far more than capacity alone suggests. Provisioned models carry no separate transaction charge.
Data Transfer and Connectivity
- Ingress and same-zone transfer are free
- Inter-region transfer in North America: $0.02 per GB
- Internet egress: first 100 GB/month free, then $0.087 per GB for the next 10 TB
- Private Link bills endpoint hours plus processed data
- VPN Gateway bills provisioned hours; partial hours count as full
Snapshots, Backup, File Sync, and Recovery
- Snapshots are incremental, not full copies
- Soft-deleted share data stays billable
- Azure Backup adds protected-instance fees (Microsoft's West Central US example: $15/month for 1.2 TB, storage extra)
- Azure File Sync: one server free per Storage Sync Service, then $5 per additional server per month
- File operations from Sync may add transaction charges on pay-as-you-go

Low-Cost vs High-Cost Azure Files: What's the Difference?
Neither is universally better. Judge price against performance, predictability, protection, and total cost.
Performance and Workload Fit
- Lower-cost configurations fit general shares, development, backup targets, and tolerant access patterns
- Higher-cost ones fit databases, VDI, analytics and AI pipelines, and metadata-heavy apps
- A high-performance tier on a quiet workload wastes money
- A low tier under a demanding workload brings throttling, disruption, and eventually a migration
Microsoft's own database sizing example uses 4,096 GiB, 20,000 IOPS, and 1,536 MiB/s. Real workloads need those kinds of specs, not guesses.
Billing Predictability and Long-Term Value
- Provisioned v2 is the easiest to forecast for stable workloads, since you choose each meter
- Pay-as-you-go tracks usage, so cost moves with activity and needs closer monitoring
- Reservations of 1 or 3 years apply to v1 SSD and pay-as-you-go hot/cool shares
- Reservations do not cover v2 or transaction-optimized, and exclude transactions, bandwidth, and metadata storage
What Most People Miss When It Comes to Azure Files Cost
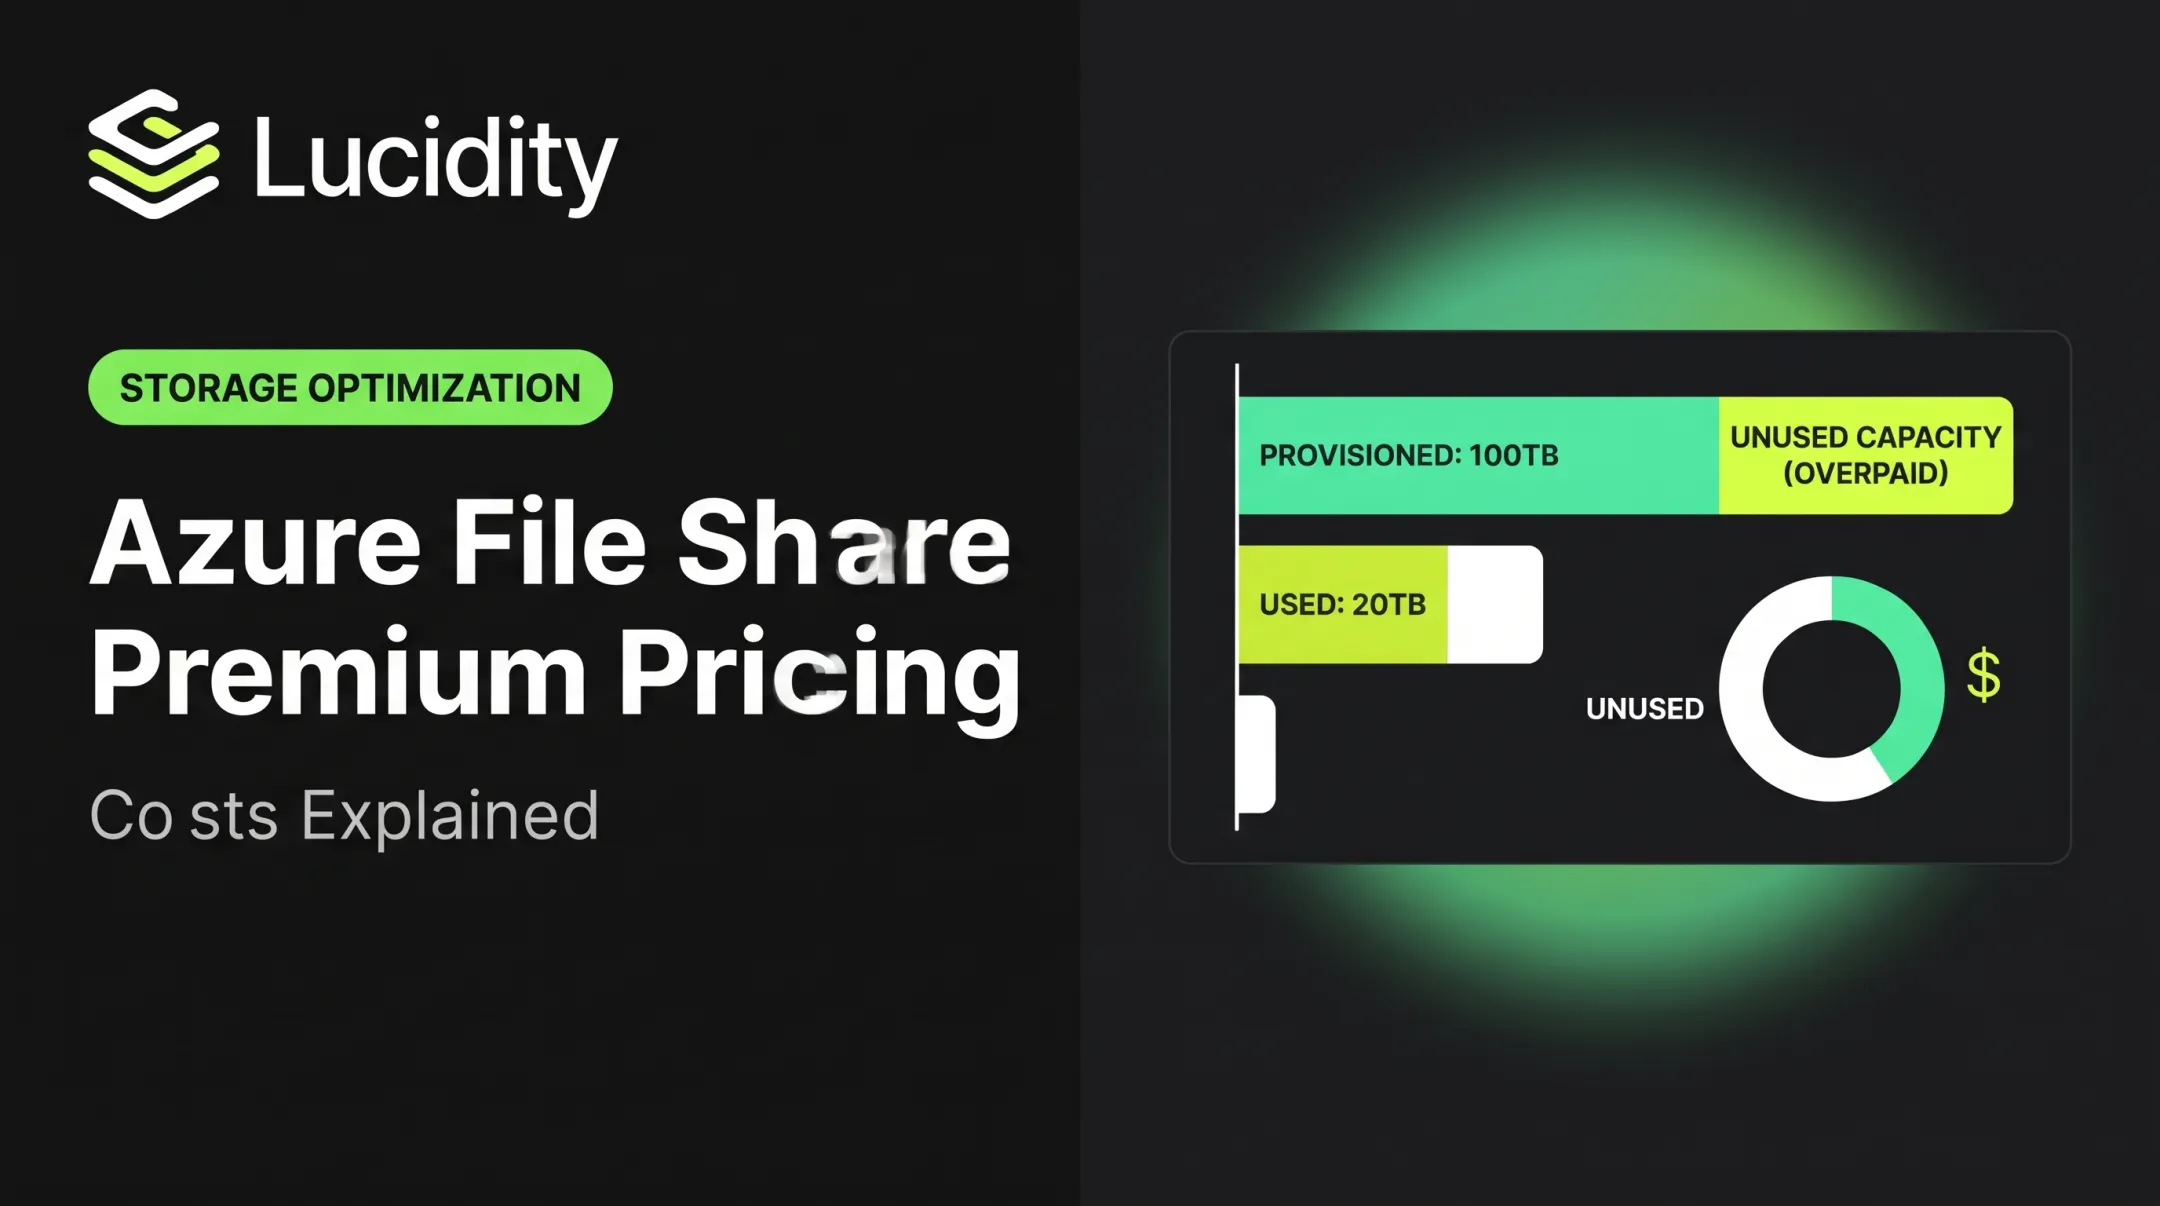
- Unused provisioned capacity is billed in full
- Hot and cool metadata has its own meter
- Tier changes trigger a transaction per file, plus retrieval charges when leaving cool
- Soft-deleted shares and snapshot deltas keep billing after the active share is gone
- Backup retention, File Sync servers, and egress sit outside the core line item
Keep four terms apart. Only some of them are charges:
- Share quota (a ceiling)
- Stored data (what you use)
- Provisioned capacity (what you buy)
- Performance reservation (IOPS and throughput you pay for)
Review usage, transactions, IOPS, throughput, and growth regularly instead of picking a tier once.
How to Estimate the Right Azure Files Budget
Start with workload fit and observed usage, not the lowest advertised rate.
Inputs to Collect Before Calculating
- Data footprint, daily and monthly growth, file and directory counts
- Average and peak transaction rates, concurrent clients, read/write ratio
- Protocol, required IOPS, throughput, and latency
- Redundancy, retention, backup, and data-transfer needs
- Region, tier, quota, provisioned capacity, and your purchasing arrangement
Estimation Formula and Scenarios
Monthly cost typically includes:
- Storage or provisioned capacity
- Transactions or performance
- Redundancy or replication
- Snapshots and backup
- Data transfer and networking
- Sync or supporting infrastructure
Run three scenarios:
- Steady state: current footprint and activity
- Expected growth: 12-month capacity and performance projections
- Peak demand: highest IOPS and throughput, plus a longer retention period

Compare how each changes with tier, quota, retention, or redundancy.
Validate and Optimize the Estimate
- Rebuild the numbers in the Azure Pricing Calculator, then compare against Azure Cost Management after deployment. Label which inputs are assumptions.
- Cost data usually arrives within 8-24 hours, and budgets evaluate every 24 hours. Alerts warn you but never stop consumption.
- Alert on capacity, transactions, IOPS, throughput, snapshots, backup, and transfer using Azure Monitor metrics such as FileCapacity, FileCount, and FileShareCapacityQuota.
If your organization also runs Azure managed disks or other block storage, Lucidity can help assess and autonomously optimize eligible cloud block-storage capacity. It does not optimize Azure Files quotas or billing.
Conclusion
Azure Files pricing depends on tier and billing model as much as capacity. Transactions, performance, redundancy, protection, and network usage all shape the final bill. Quota planning means verifying Microsoft's current limits and separating service ceilings from billable capacity.
Model a realistic workload in the Azure Pricing Calculator, then validate it against Azure Cost Management. Choose the configuration that balances performance, reliability, predictability, and long-term value.
Frequently Asked Questions
What is Azure Files storage?
Azure Files is a fully managed cloud file-share service. Users and applications mount shares over SMB or NFS, making it a fit for shared-file and lift-and-shift workloads.
Is Azure Files the same as Blob Storage?
No. Azure Files offers share-based, file-system access with real directories, while Blob Storage uses object access in a flat namespace. Choose based on your application's protocol needs.
Does Azure Files use SMB?
Yes. It supports SMB 3.1.1, 3.0, and 2.1, and NFS 4.1 on SSD shares only. Authentication and encryption options vary by configuration, so check current Microsoft documentation.
How much is Azure storage per GB?
There is no universal figure. Rates depend on region, tier, billing model, redundancy, capacity, and transactions. In East US 2, they range from $0.0073 to $0.16 per GiB-month before other meters.
What are the Azure Files storage quotas and limits?
A share quota is a configurable cap; service limits are fixed ceilings on size, IOPS, throughput, and accounts. Share capacity tops out at 100 TiB on v1 SSD and pay-as-you-go, or 256 TiB on v2. Confirm current values with Microsoft.
How can I estimate and reduce Azure Files costs?
Choose the tier from actual workload behavior and model it in the Pricing Calculator. Monitor capacity and transactions, remove unneeded snapshots and replication, and review provisioned performance and quota use regularly.